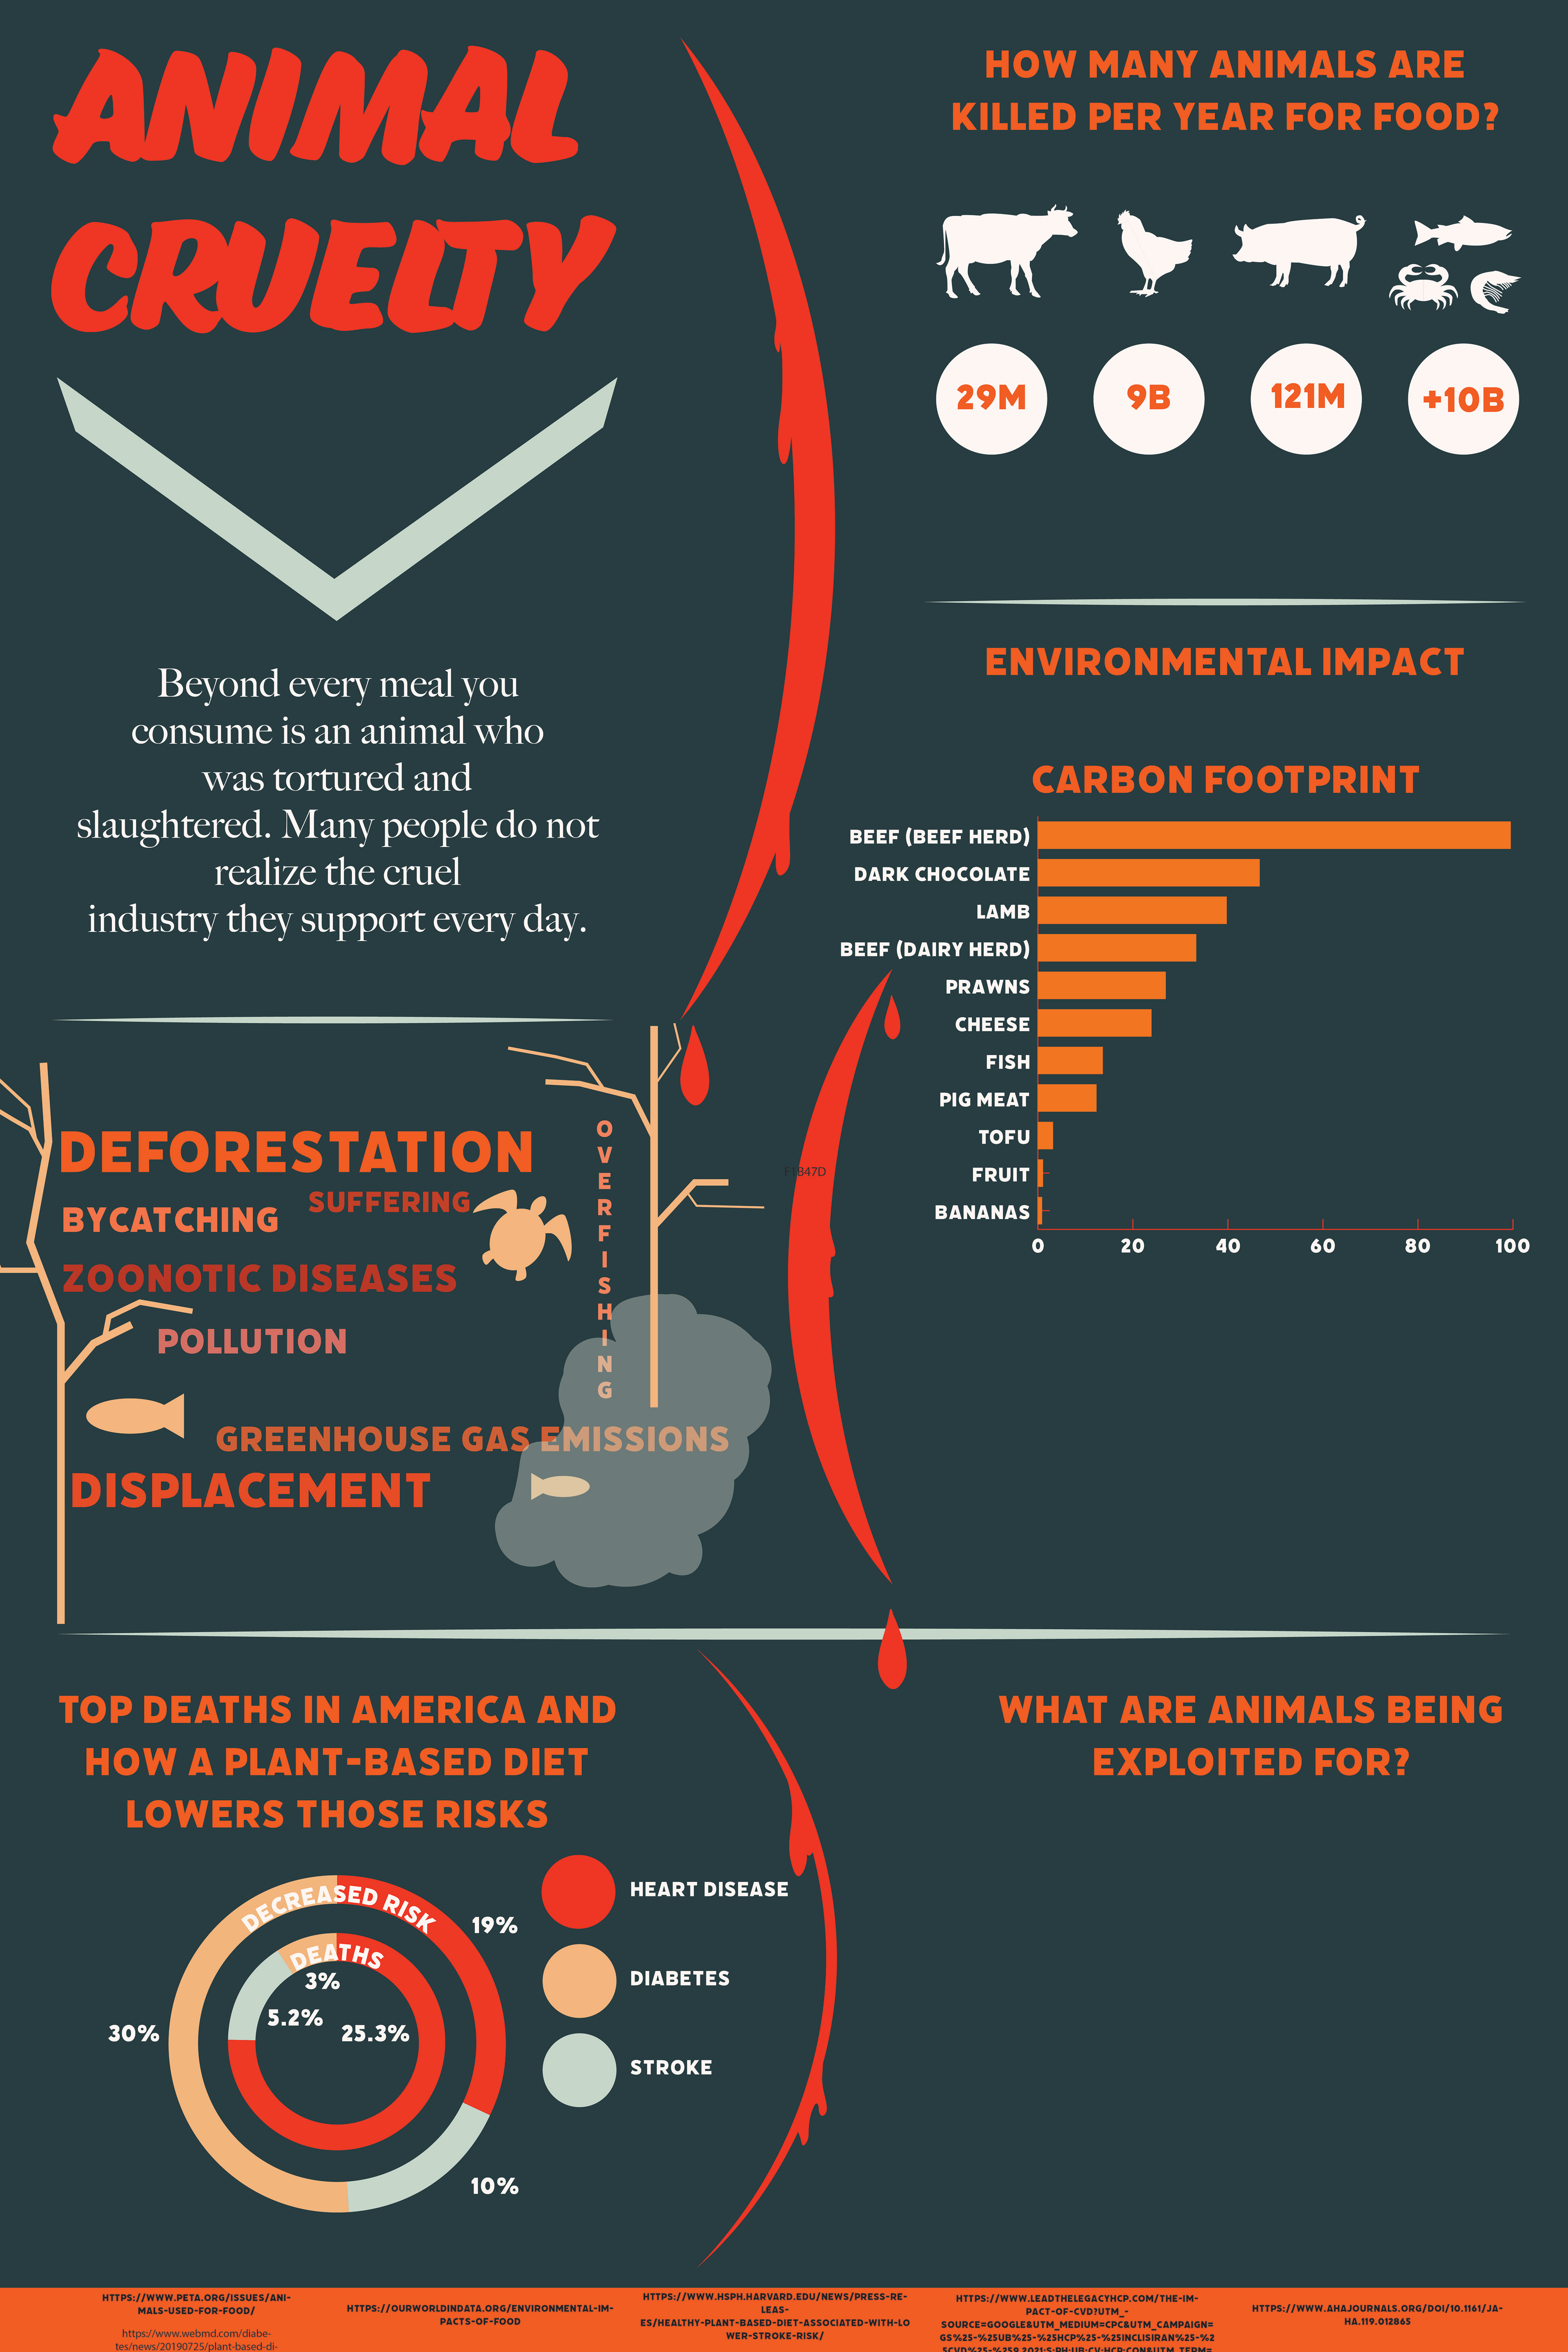
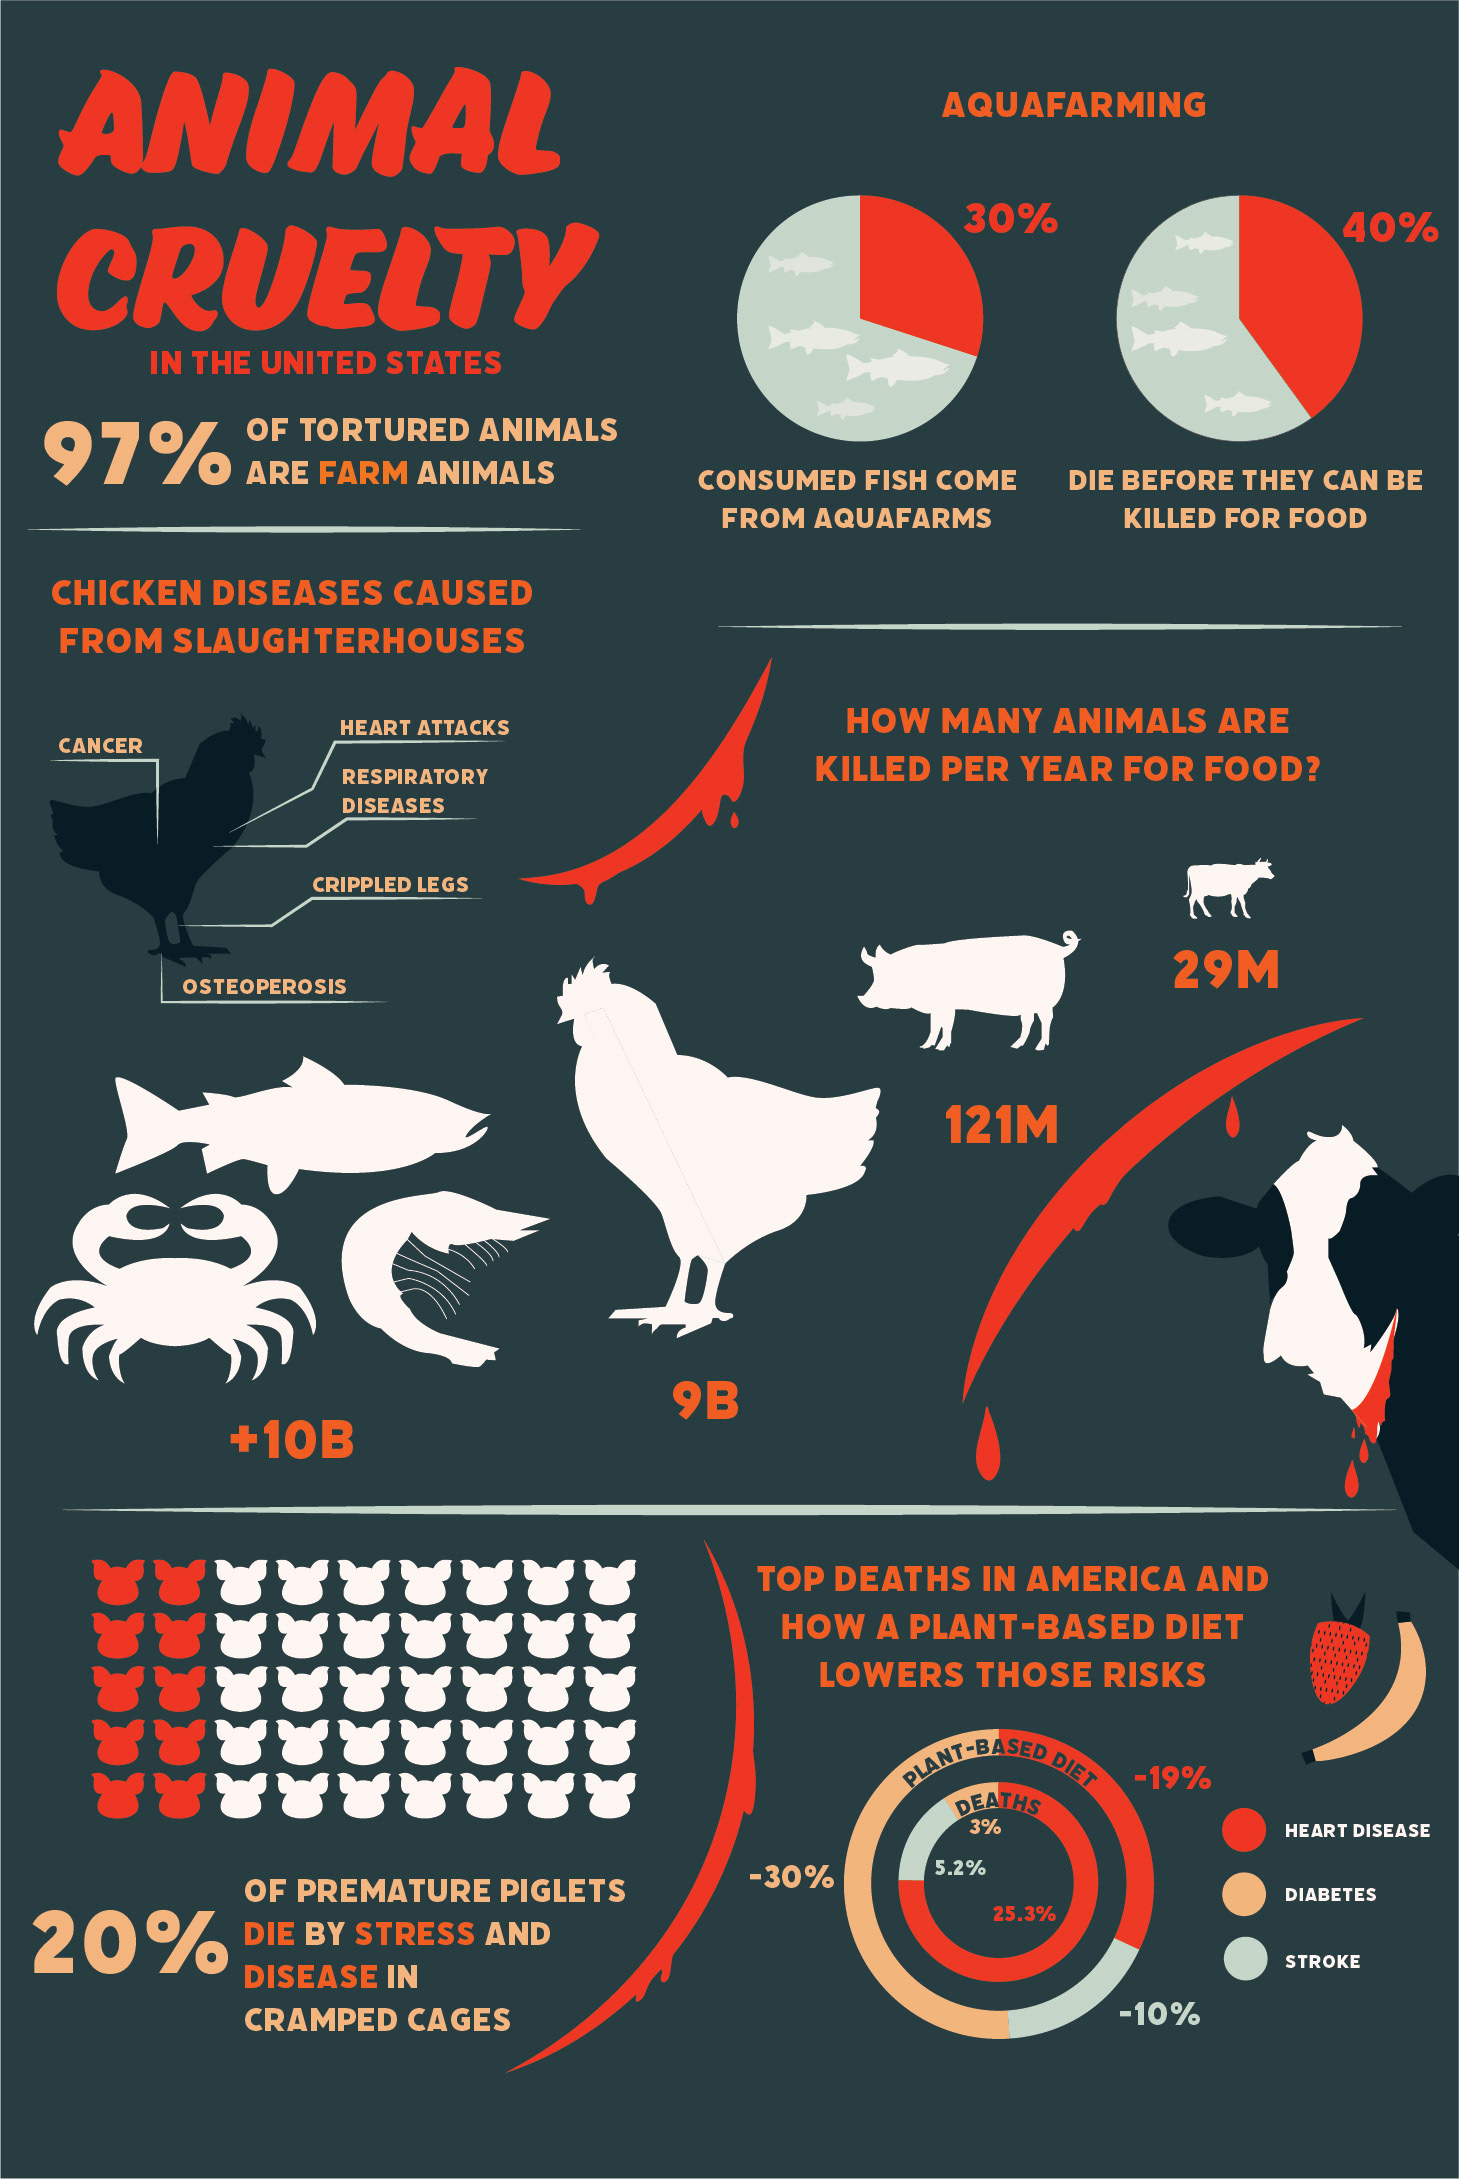
One of my college projects was to create an infographic based on a social injustice. I chose animal cruelty, as that is close to my heart. I needed to use at least four different graphs to get the information across.
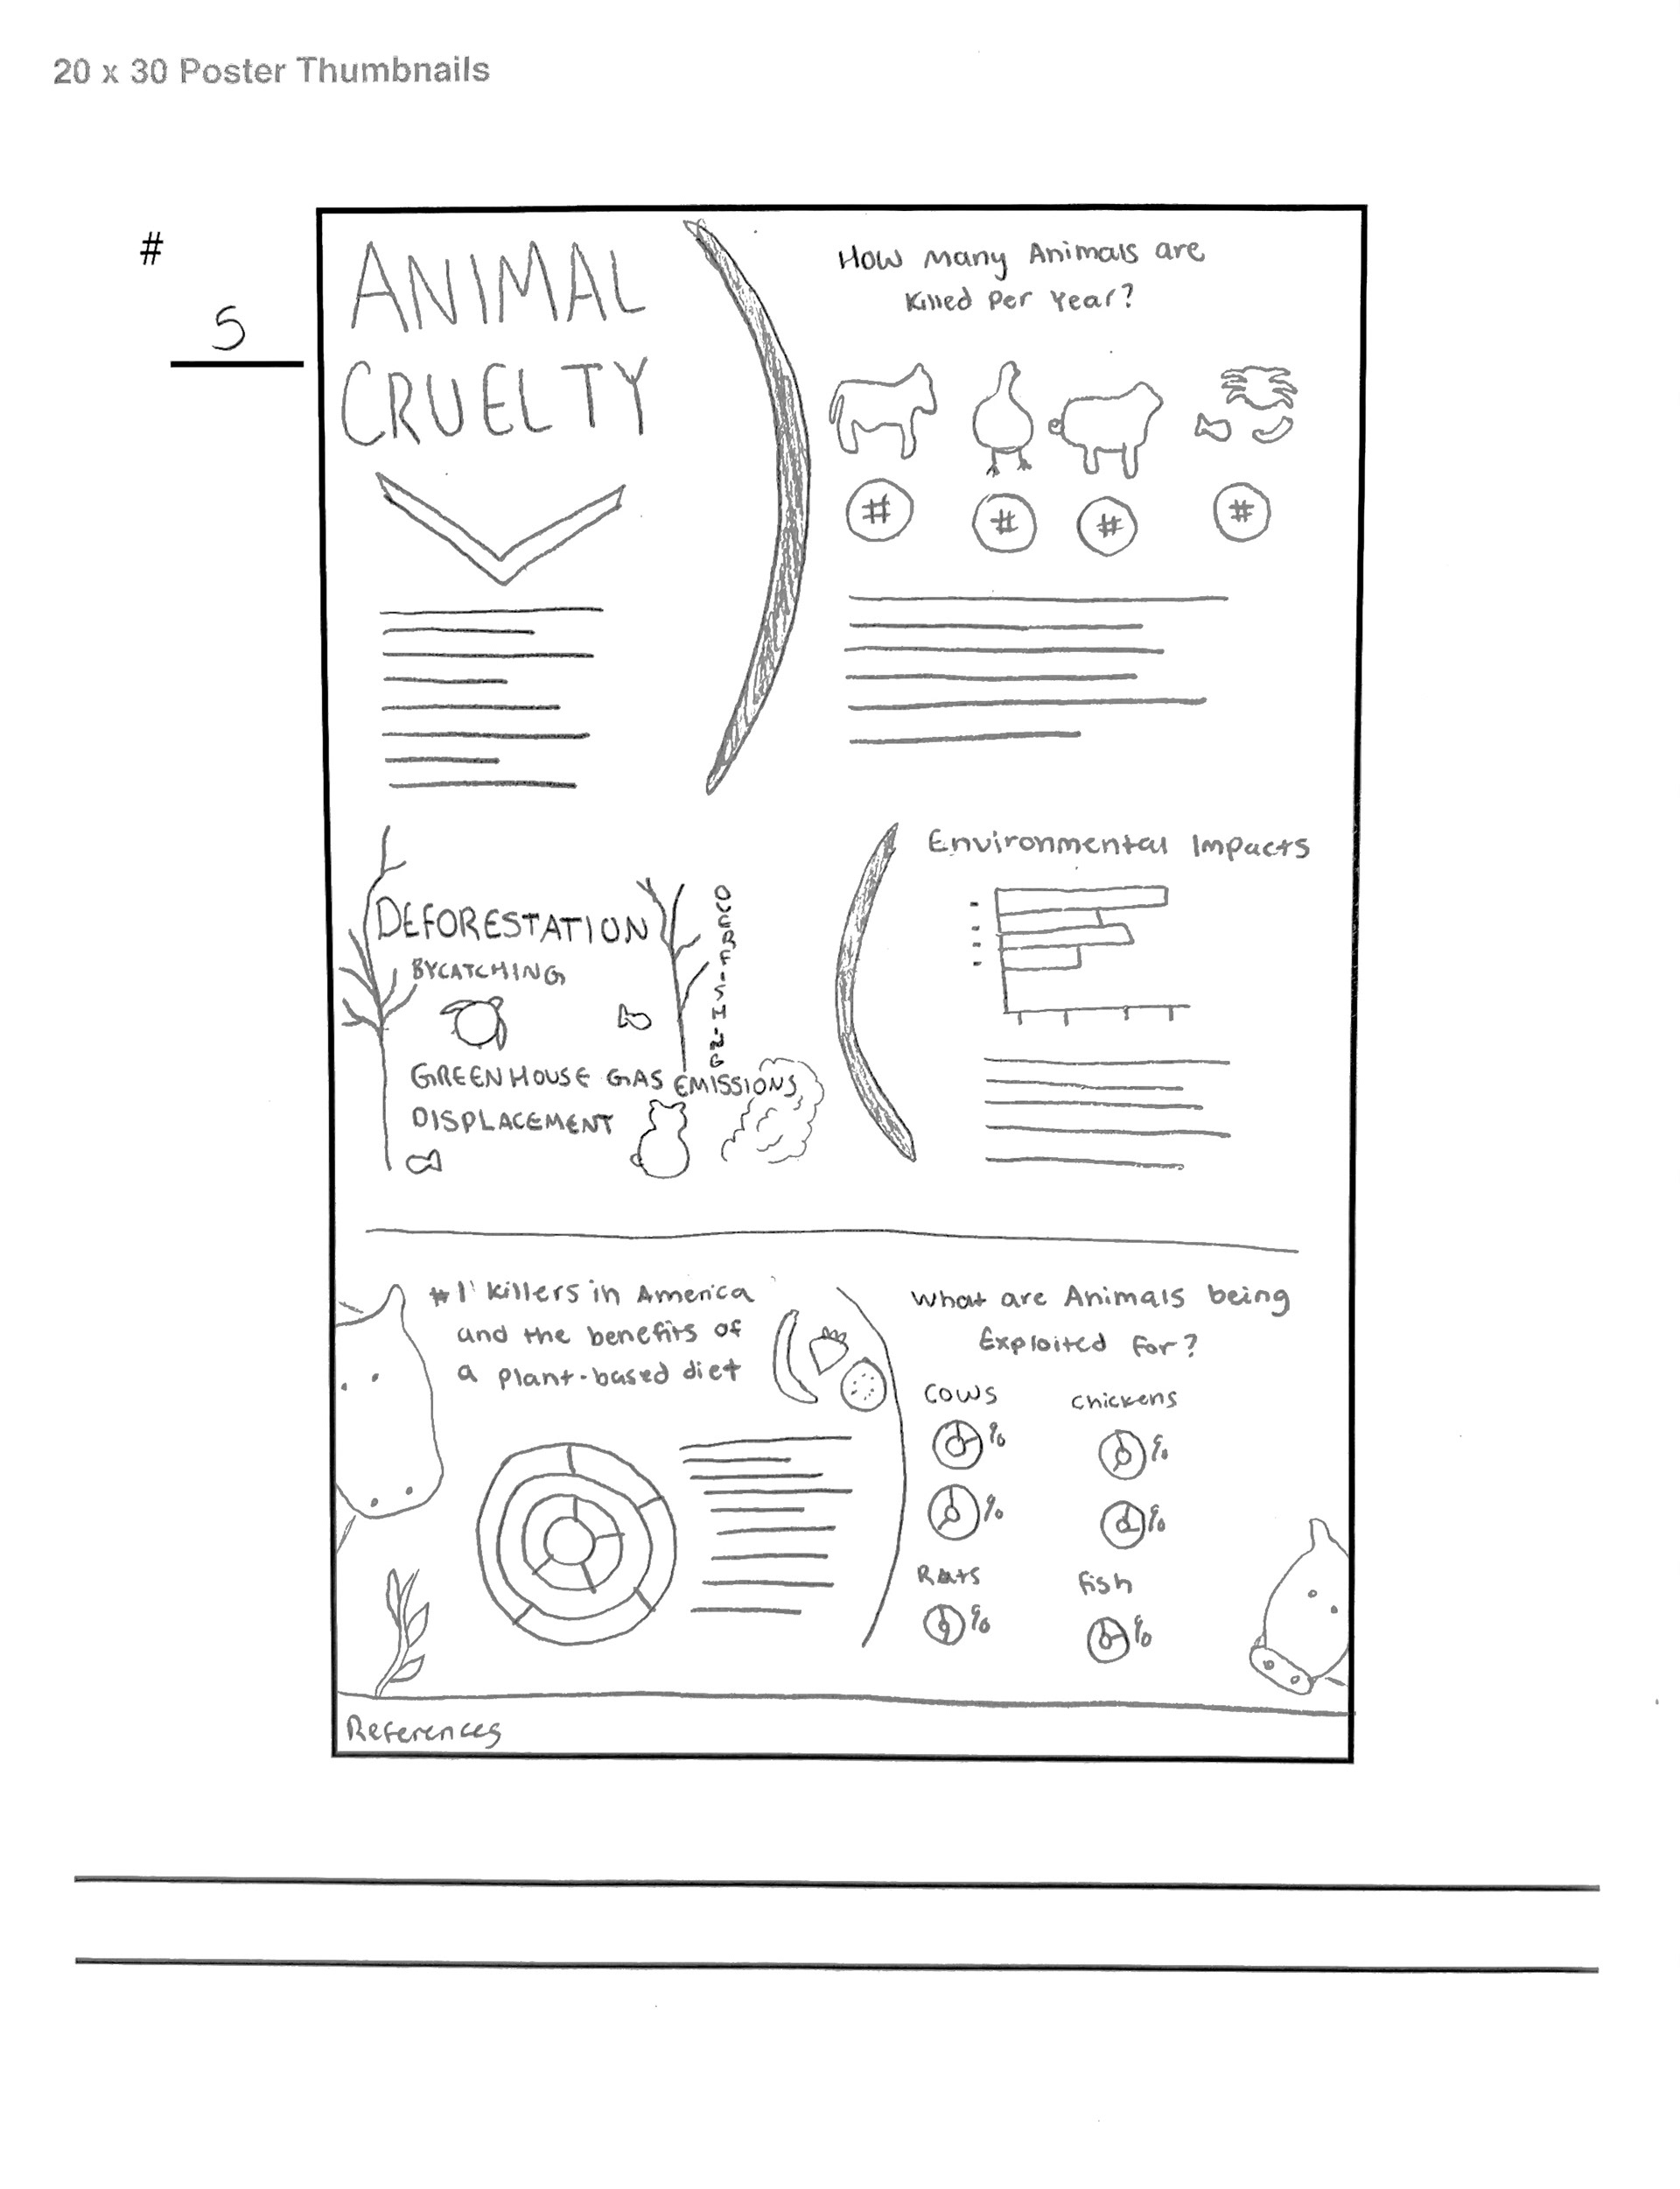
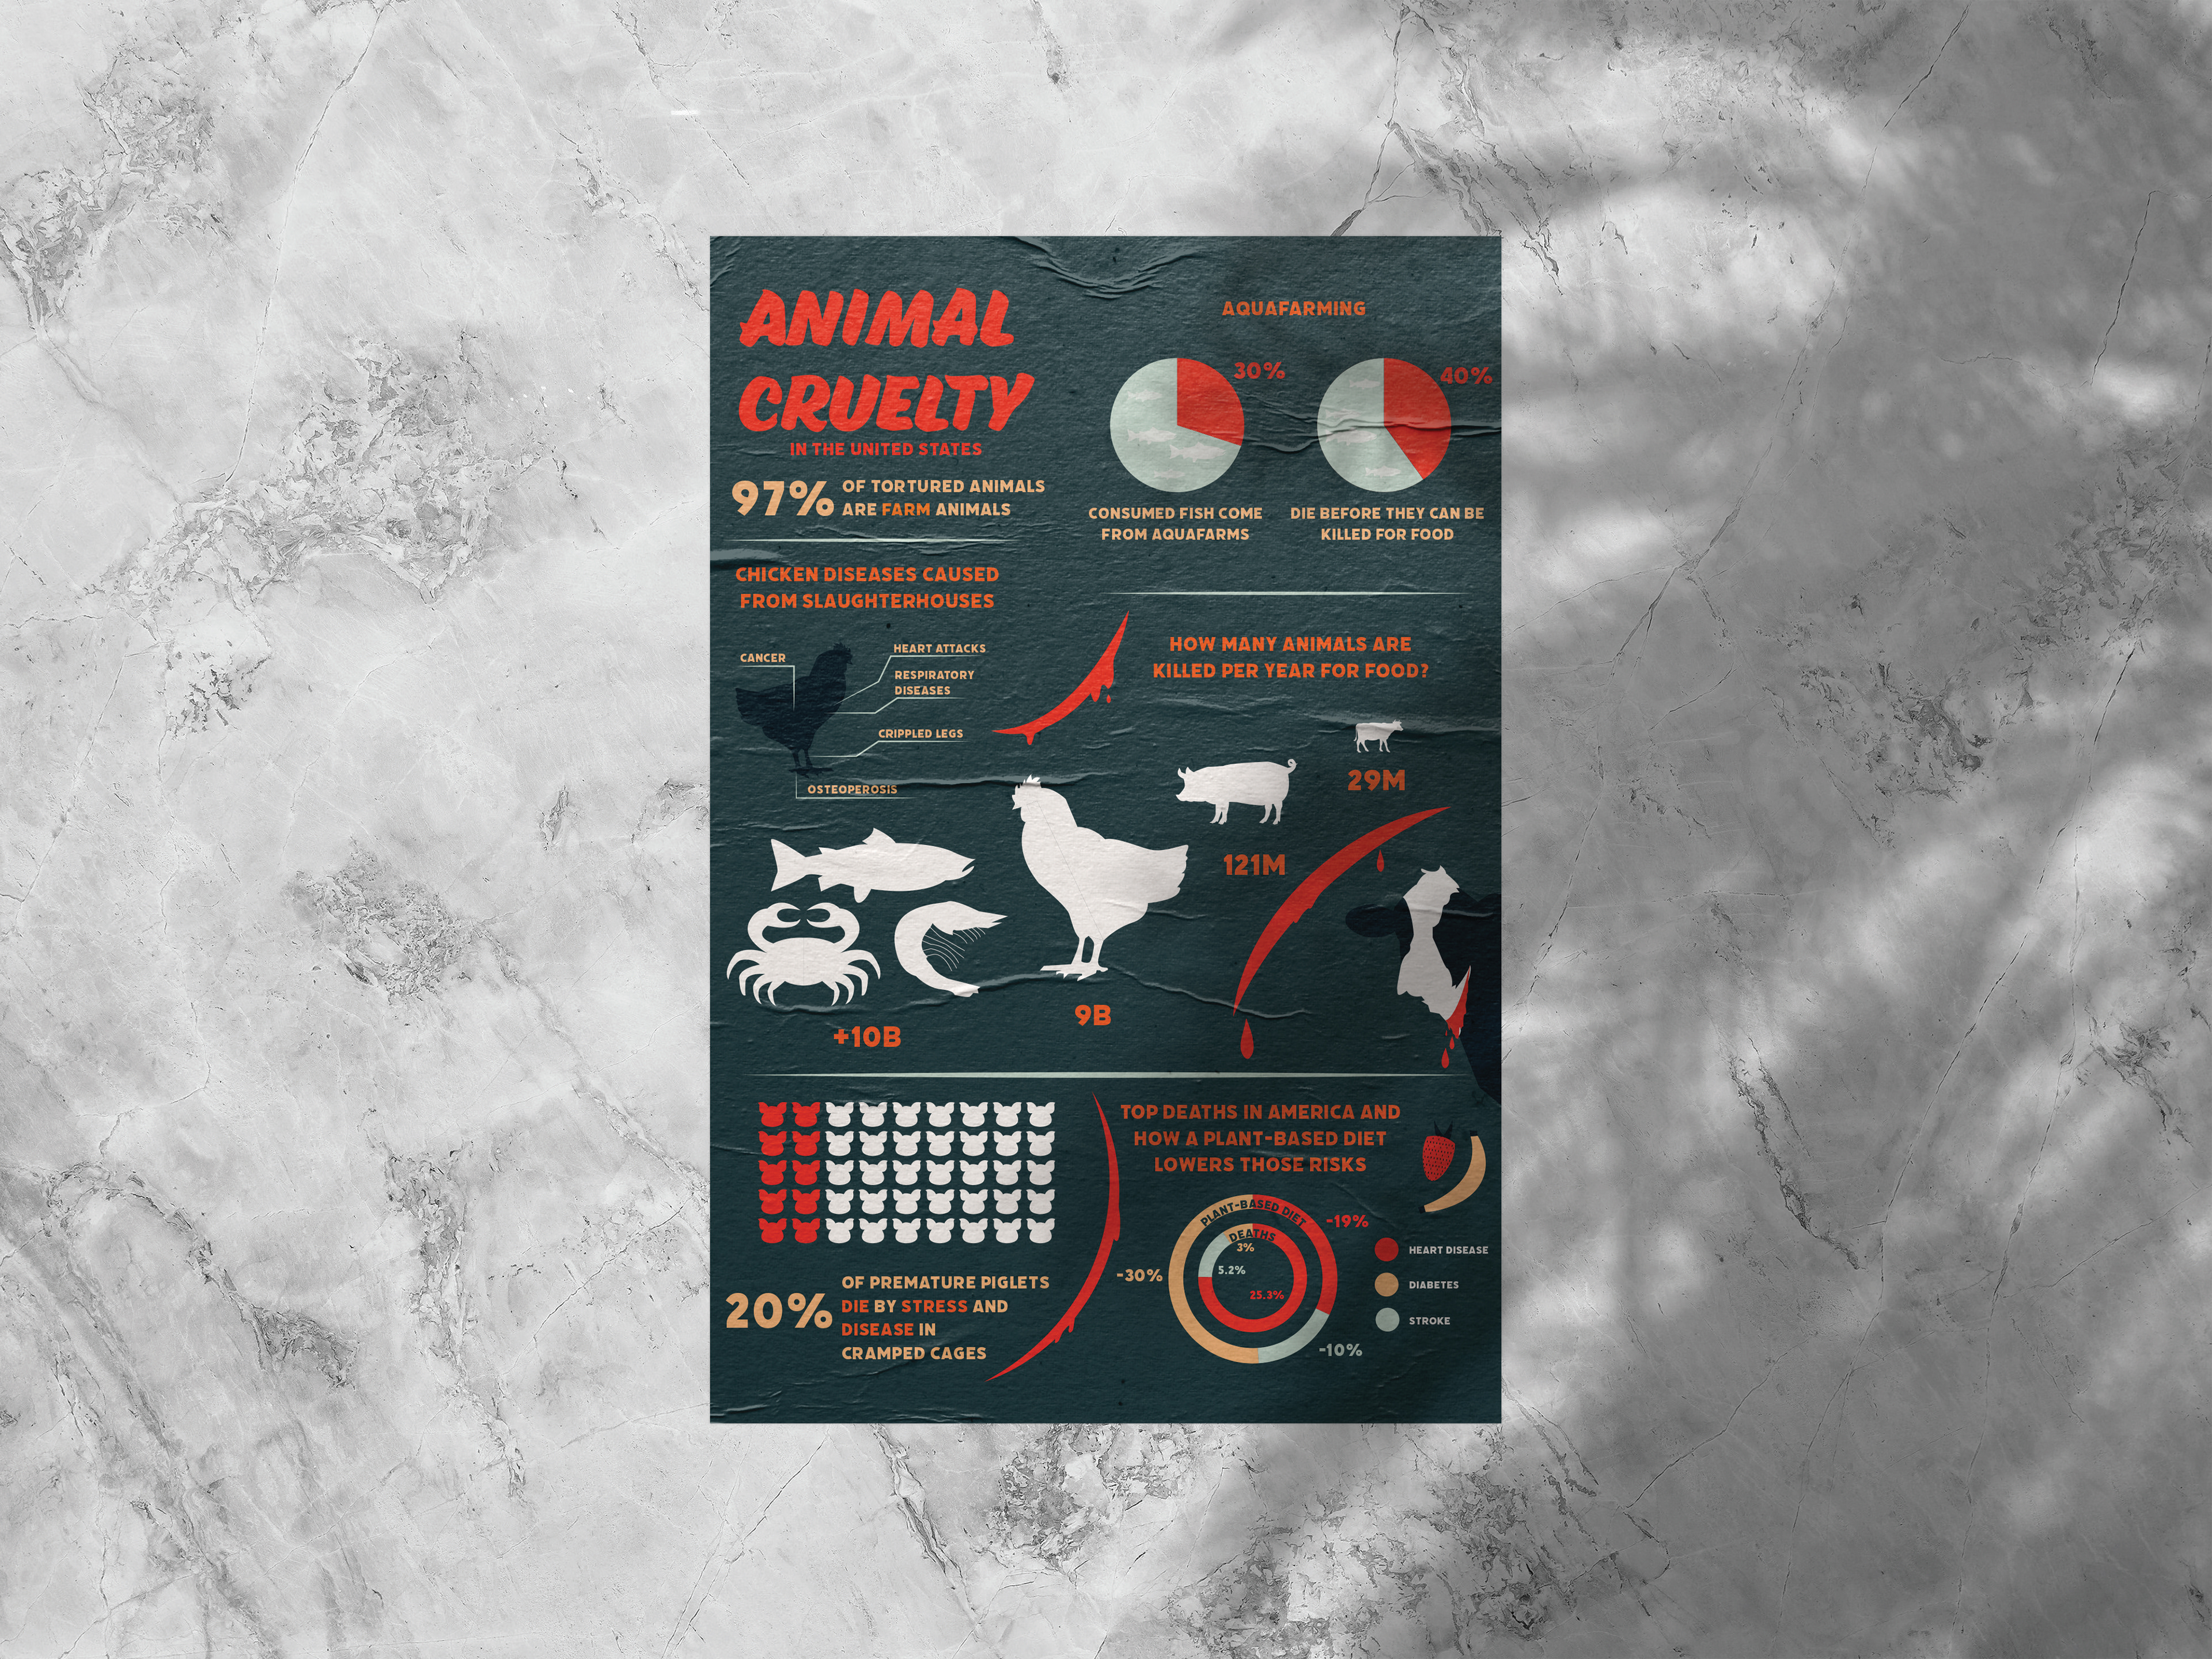
On the left shows my comp, while on the right shows my final design